Revelations are not the exclusive province of Catholic saints. One day in the early 1980s, a colleague of mine rushed into my office and put a brightly colored image on my desk. - Look! he said, subdued jubilation in his voice. - Pretty, what is it? - It is the Mandelbrot set!
There was reverence in his usually irreverent voice. My colleague was something of a free spirit, working for me as a programmer and pursuing his career as a rock musician, on alternate weeks. It was clear that he was deeply moved by the image he had put on my desk. He looked as if something incredible had just happened to him on the way to Damascus.
This was the first time I heard the name Mandelbrot and saw one of the images that are now so familiar, even in poster art.
Initially, the images may look impressive, but then there are many examples of artists using computers to generate art. Even children learn how to make Lissajou figures. The real shock sets in when you learn that these incredibly intricate pictures are generated by an extremely simple mathematical formula:
zn+1 = zn2 + C
Here, C is a constant and z is a variable that is calculated iteratively using the formula. In the Mandelbrot set, the initial value of z, z0 = 0, so z1 = C, z2 = C2 + C etc. The set is defined simply as those values (or instances) of C where zn remains limited no matter how many iterations are performed.
Clearly, if C = 0, then z will remain 0 no matter how many iterations we perform, so C = 0 is a member of the Mandelbrot set. On the other hand, if C = 10 or C = -10, z will rapidly grow beyond all bounds, so these values do not belong to the set.
This seems trivial enough, but it is not quite that trivial. Both zn and C are complex numbers, each number having a "real" and an "imaginary" part. Just as "real" numbers are geometrically represented as points on a line, "complex" numbers are geometrically represented as points in a plane. Therefore, all possible values of C can be represented as points in a two-dimensional diagram.
In such a diagram, C values that give bounded values of zn no matter how large n is allowed to become (i. e. no matter how many iterations are performed) can be assigned a black color, while C values that lead to unlimited growth of zn as n grows large can be assigned the background color. The Mandelbrot set then looks like this:
A rather unremarkable shape with some protrusions. However, if one zooms in on one of those, similar protrusions at smaller scale appear at successively larger magnifications. - Interesting, but not enough to make your jaw drop.
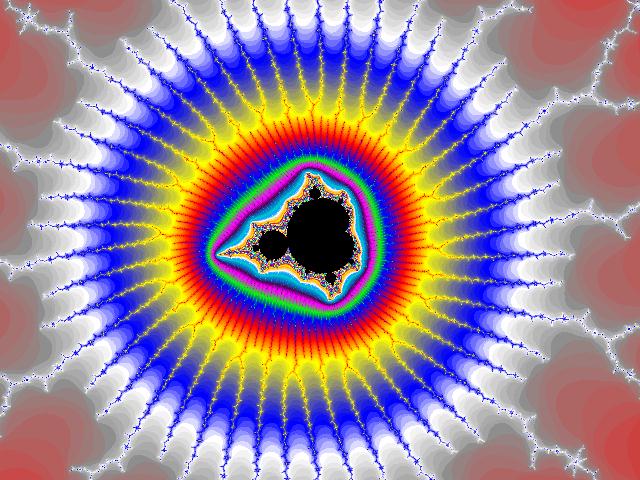
But if, for a given C value, we count the number of iterations needed for z to surpass a certain limit, and assign a color to C at that point that corresponds to the number of iterations needed, amazing things start to happen. This will be especially interesting along the border between the area where z values remain limited and the area where z values increase without limit. This border region is where z is "balancing" between containment and divergence.
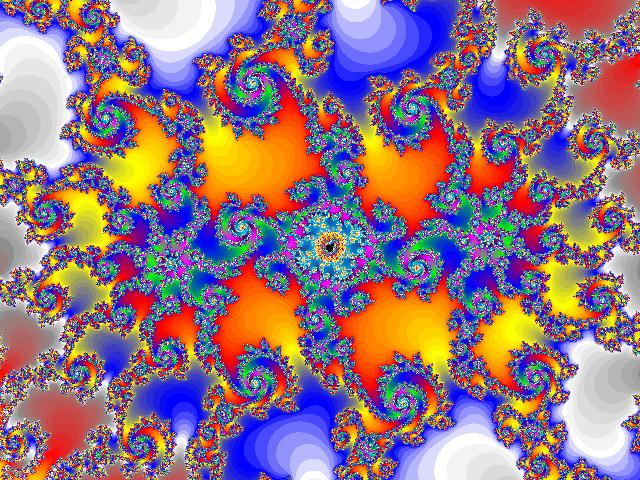
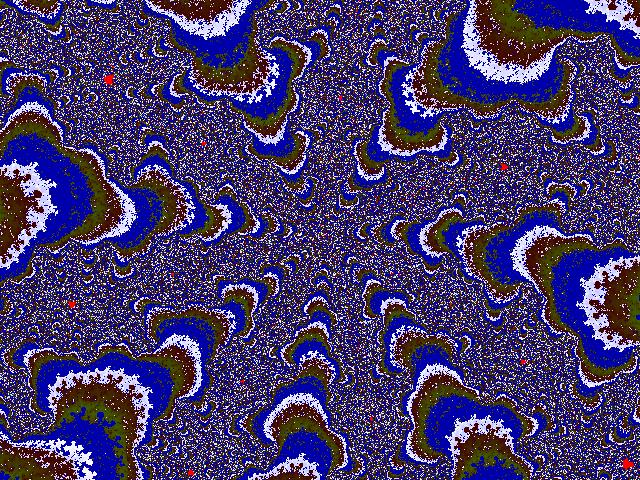
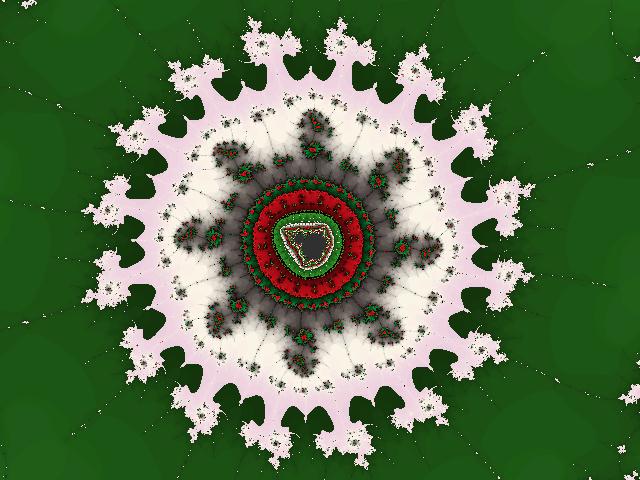
Here is a gallery of some images that have been generated in this manner. The only parameters that are decided by the programmer/artist are the size limit of z, the area to be depicted, and the color coding. This leaves some room for artistic creativity, but the structures themselves are all defined by the mathematics. They are an inherent feature of the universe and will look no different to our brothers in the Andromeda galaxy!
Click to enlarge.
Those swirling patterns continue endlessly at larger magnification. Similar structures will emerge if we magnify the images by a factor of a thousand or a trillion. They are self-similar but not repetitive, i. e. at successively larger magnification, the images resemble each other but they are never exactly the same.
The shapes may remind us of biological specimens, and this is probably not just coincidence. Biology, too, exhibits great complexity based on simple underlying principles. The spiral shapes that occur in snails, flowers - and in the Mandelbrot set - may be one example of this. - Today, Mandelbrot's line of research (fractals and self-similarity) has opened up practical applications in such fields as image compression.
The Mandelbrot set is closely related to Julia sets, studied early in the last century by the French mathematician Gaston Julia (who had the misfortune to lose his nose in World War I). Julia was interested in divergence arising from repeated iterations of polynomials of complex numbers. His field of research remained obscure until Benoit Mandelbrot took advantage of the possibilities offered by computers to do experiments during his research at IBM in the 1970s. The subsequent explosion of personal computing and computer graphics opened up the field to thousands of interested amateurs.
Today, any interested aficionado can explore the Mandelbrot set at home, using one of the many tools that are available on the Internet. ("Mandelbrot" is a good search term. There are not that many "false positives"!) Here is one (Java must be installed).
Familiarity breeds contempt, and most scientifically literate laymen have now gotten accustomed to looking at Mandelbrot images without giving much thought to the underlying phenomenon of complexity arising out of simplicity. But somewhere in there, there is room for awe and - perhaps - for inspiration and hope.